
The Influence Mechanism of Industrial Agglomeration on Forestry Green Total Factor Productivity from the Perspective of Financial Support
-
摘要:
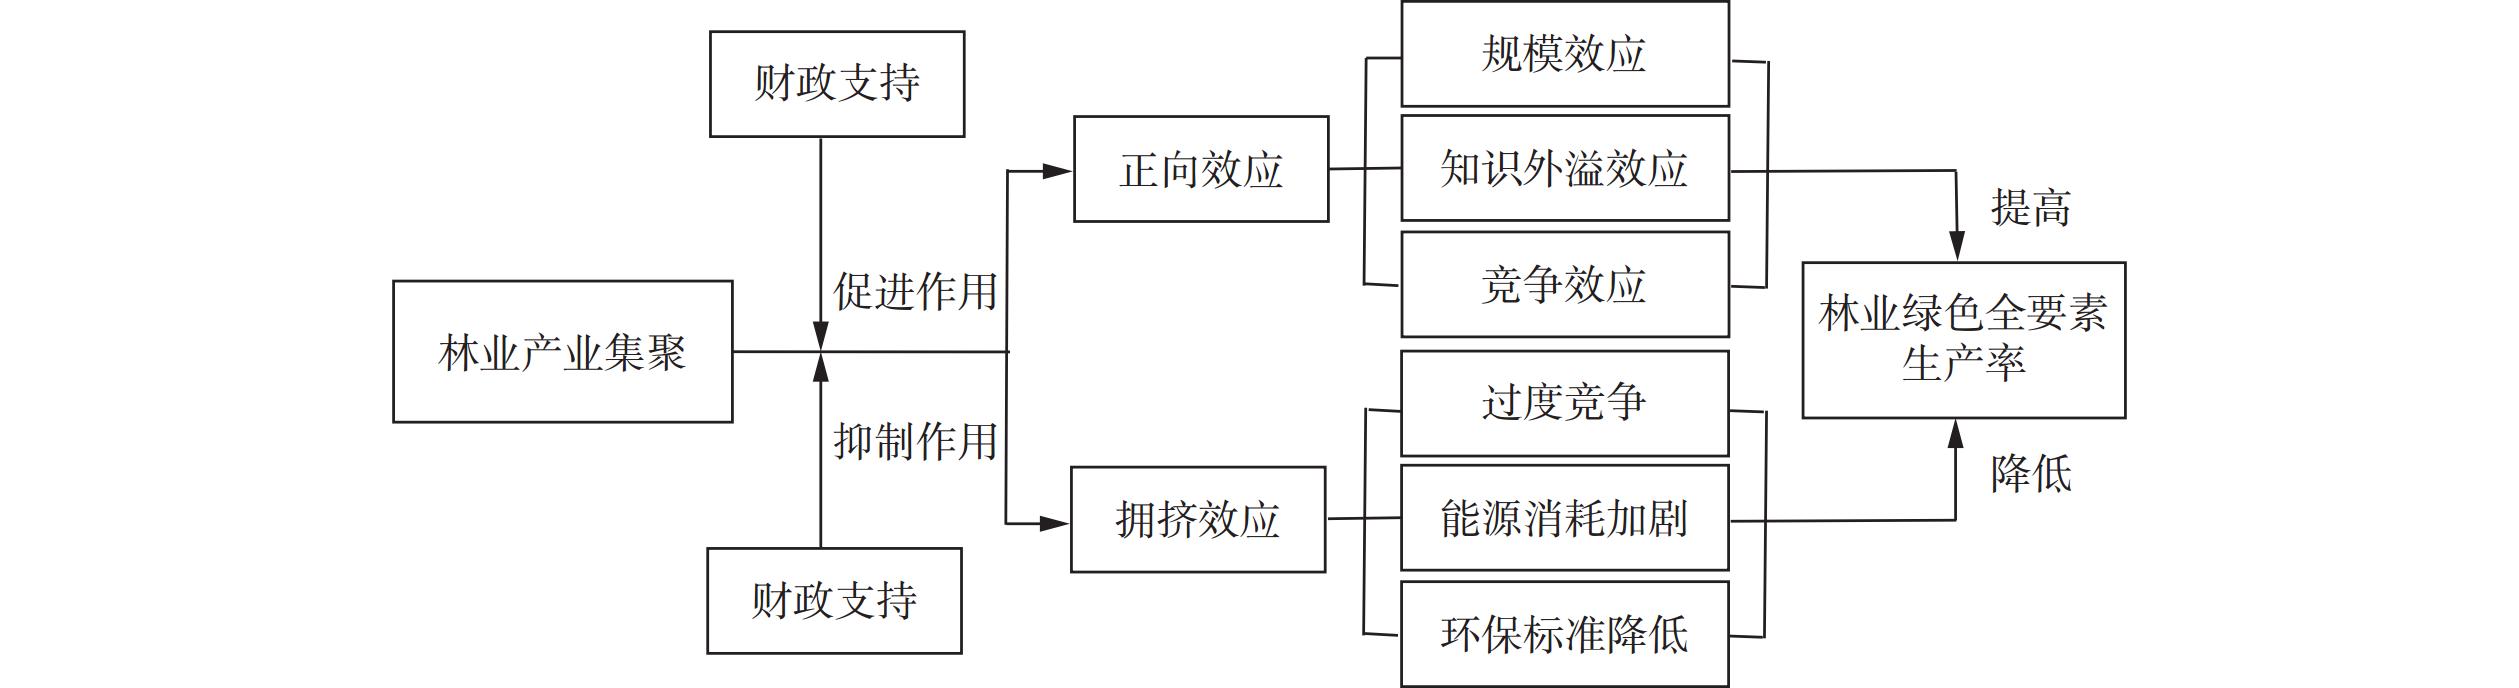
基于各地区统计年鉴中的面板数据,运用非期望产出超效率SBM-Malmquist指数模型测度中国30个省份2008—2019年的林业绿色全要素生产率及异质性结构,并通过构建非线性动态面板门槛回归模型,从财政支持视角探析林业产业集聚对林业绿色全要素生产率的影响机制。研究发现:从总体上看,我国林业绿色全要素生产率呈缓慢增长趋势,但逐年波动明显且存在区域异质性。此外,在不同财政支持水平下,林业产业集聚对林业绿色全要素生产率的影响呈现非线性特征,即较低的财政支持水平抑制了林业产业集聚对林业绿色全要素生产率提高的促进作用,而随着财政支持水平的提高并超过临界值,林业产业集聚可以更好地发挥正外部性进而促进林业绿色全要素生产率提高。研究结论为推进我国生态文明建设和实现林业现代化发展提供了新视角、新方案。
-
关键词:
- 林业绿色全要素生产率 /
- 产业集聚 /
- 财政支持 /
- 异质门槛效应
Abstract:Based on the panel data from the regional statistical yearbook, this paper uses the non-expected output superefficiency SBM-Malmquist index model to measure the forest green total factor productivity and its heterogeneity structure in 30 provinces of China from 2008 to 2019. By constructing a nonlinear dynamic panel threshold regression model, the influence mechanism of forestry industry agglomeration on forestry green total factor productivity was analyzed from the perspective of financial support. The results show that: overall, the green total factor productivity of Chinese forestry is in a slow growth trend, but it fluctuates obviously year by year and there is regional heterogeneity. In addition, under different financial support levels, the effect of forestry industry agglomeration on forestry green total factor productivity presents nonlinear characteristics, that is, lower financial support level inhibits the positive effect of forestry industry agglomeration on the improvement of forestry green total factor productivity. However, when the financial support level increases and exceeds the critical value, the positive externalities of forestry industry agglomeration can be better utilized to promote the improvement of forestry green total factor productivity. The paper provides a new perspective and a new plan for promoting ecological civilization construction and realizing forestry modernization.
-
-
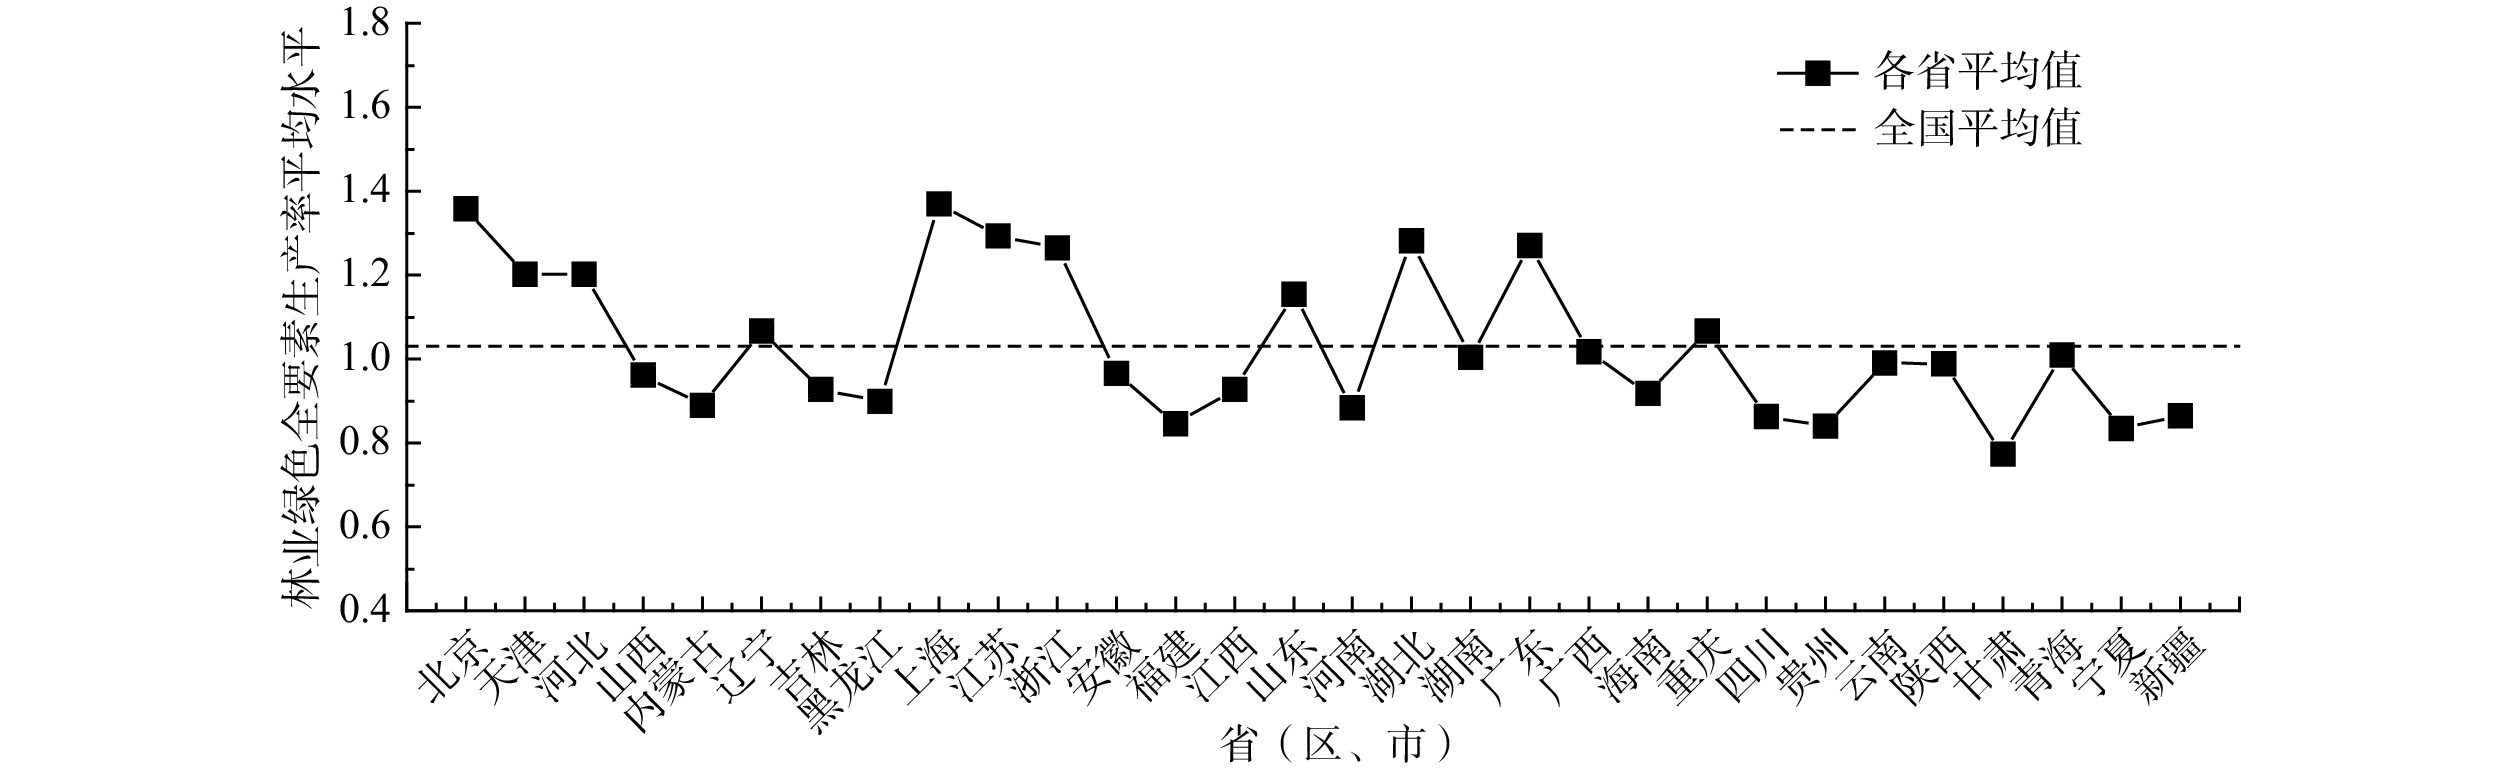
表 1 2008—2019年我国各省份林业绿色全要素生产率
省(区、市) 2008 2009 2010 2011 2012 2013 2014 2015 2016 2017 2018 2019 均值 北京 1.313 1.334 1.399 1.083 1.310 1.420 1.365 1.391 1.432 1.393 1.249 1.602 1.358 天津 1.199 1.071 1.299 0.971 1.148 1.186 1.253 1.149 1.330 1.127 1.249 1.442 1.202 河北 1.175 1.154 1.098 1.213 1.213 1.193 1.266 1.146 1.127 1.033 1.374 1.415 1.201 山西 0.987 0.854 0.794 0.548 0.801 0.867 1.011 0.757 1.295 1.271 1.113 1.237 0.961 内蒙古 0.919 0.780 0.835 0.646 0.951 0.979 0.678 0.793 0.895 0.889 1.089 1.229 0.890 辽宁 1.020 0.879 1.516 1.088 1.024 1.000 1.063 0.890 0.970 1.080 1.102 1.161 1.066 吉林 0.968 0.991 1.113 0.755 0.851 0.878 0.846 0.928 0.783 0.844 1.072 1.097 0.927 黑龙江 1.157 0.795 0.985 0.496 0.910 0.878 0.790 0.852 1.043 0.720 1.025 1.149 0.900 上海 1.064 1.036 0.997 1.150 1.584 1.334 1.330 1.382 1.602 1.540 1.584 1.834 1.370 江苏 1.204 1.143 1.337 1.094 1.123 1.170 1.224 1.244 1.303 1.379 1.542 1.761 1.294 浙江 1.089 1.151 0.904 1.067 1.327 1.187 1.359 1.251 1.355 1.331 1.455 1.696 1.264 安徽 0.864 0.883 0.922 0.779 0.907 0.961 1.109 0.965 1.065 1.013 1.075 1.050 0.966 福建 0.867 0.866 0.673 0.775 0.632 0.775 0.810 0.773 0.944 0.967 1.051 1.019 0.846 江西 0.806 0.866 0.859 0.708 0.838 0.988 0.872 0.928 1.026 1.003 1.094 1.142 0.927 山东 1.153 0.975 1.368 1.039 1.025 1.275 1.102 1.029 1.048 1.184 1.247 1.410 1.155 河南 0.990 0.418 0.700 0.755 0.641 0.921 0.962 0.805 0.897 1.093 1.150 1.262 0.883 湖北 1.123 1.087 1.281 1.102 1.226 1.288 1.250 1.311 1.385 1.381 1.415 1.538 1.282 湖南 0.965 0.917 1.008 0.848 0.822 0.921 1.062 0.914 1.143 1.065 1.154 1.226 1.004 广东 1.237 1.199 1.177 1.002 1.066 1.133 1.260 1.190 1.443 1.422 1.507 1.615 1.271 广西 0.954 0.905 1.009 0.964 1.039 1.025 0.904 0.929 1.020 0.970 1.181 1.301 1.017 海南 0.808 0.788 1.104 0.831 0.566 0.874 0.862 0.911 0.985 1.045 1.082 1.175 0.919 重庆 1.090 1.021 0.817 0.922 0.947 0.924 0.893 1.185 1.104 1.209 1.254 1.439 1.067 四川 0.871 0.787 0.833 0.650 0.666 0.845 0.839 0.909 0.930 0.962 0.972 1.094 0.863 贵州 0.824 0.614 0.761 0.744 0.846 0.832 0.784 0.918 1.026 0.815 0.929 0.987 0.840 云南 0.969 0.992 0.865 0.924 0.903 0.836 0.996 1.070 1.141 0.993 1.023 1.179 0.991 陕西 1.049 0.868 1.004 0.904 0.999 0.915 1.054 0.920 0.874 0.982 1.053 1.232 0.988 甘肃 0.801 0.822 0.782 0.616 0.705 0.691 0.620 0.764 0.828 0.798 0.852 0.998 0.773 青海 1.022 1.026 1.127 0.988 0.869 0.863 0.910 0.885 1.074 1.013 1.074 1.257 1.009 宁夏 0.809 0.609 0.730 0.790 0.553 0.776 0.821 0.994 0.894 0.943 1.051 1.046 0.835 新疆 0.891 0.772 0.897 0.766 0.746 0.781 0.896 0.816 0.961 0.970 0.901 0.985 0.865 全国 1.006 0.920 1.006 0.874 0.941 0.991 1.006 1.000 1.097 1.081 1.164 1.286 1.031  下载: 导出CSV
表 2 变量的描述性统计
变量名称 变量符号 平均值 中位数 标准差 最小值 最大值 林业绿色全
要素生产率P 1.031 1.001 0.474 0.418 1.602 林业产业集聚 C 1.314 0.863 1.420 0.031 10.004 财政支持水平 G 0.454 0.321 0.458 0.002 2.789 宏观经济
发展水平L 4.421 3.904 2.500 0.729 14.076 森林受灾度 D 3.853 3.274 3.208 0.045 20.115 外商投资 F 3.824 0.523 10.786 0.077 60.284 技术创新 T 7.776 3.651 10.565 0.350 70.839
下载: 导出CSV
表 3 财政支持门槛效应检验结果
门槛 F值 P值 抽样次数 临界值 1% 5% 10% 单一门槛 25.842*** 0.010 300 27.015 6.406 3.339 双重门槛 77.458*** 0.003 300 64.535 9.083 5.170 三重门槛 0.237 0.683 300 8.036 5.223 3.645 注:P值和临界值均为采用自抽样法(Bootstrap)反复抽样300次得到的结果,***表示在1%的水平上显著。
下载: 导出CSV
表 4 财政支持门槛效应估计值
门槛 门槛效应估计值 95%置信区间 单一门槛 0.208 [0.028,0.260] 双重门槛 0.276 [0.276,0.296] 0.237 [0.208,0.252] 三重门槛 0.298 [0.295,0.309]
下载: 导出CSV
表 5 门槛效应估计结果
变量 系数 标准误 z值 P值 95%置信区间 林业绿色全要素生产率滞后项一阶 0.0544* 0.0284 1.91 0.056 [−0.0013,0.1101] 林业绿色全要素生产率滞后项二阶 −0.0344** 0.0153 −2.25 0.025 [−0.0644,−0.0044] 宏观经济发展水平 0.0522*** 0.0137 3.82 0.000 [0.0254,0.0791] 森林受灾度 −0.0007** 0.0003 −2.23 0.026 [−0.0013,−0.0001] 外商投资 −0.0004** 0.0001 −3.03 0.002 [−0.0006,−0.0001] 技术创新 0.0038 0.0027 1.40 0.163 [0.0002,0.0015] 林业产业集聚(G ≤ 0.237) −0.2188** 0.0131 −2.44 0.015 [−0.0574,−0.0062] 林业产业集聚(0.237 < G ≤ 0.276) 0.7346*** 0.0223 16.73 0.000 [0.3295,0.4169] 林业产业集聚(G > 0.276) 0.0305 0.0147 0.18 0.854 [−0.0262,0.0316] 常数项 0.9214 0.0753 12.31 0.000 [0.7801,1.0754] 注:*、**、***分别表示在10%、5%、1%的水平上显著。
下载: 导出CSV
-
[1] 侯建,刘青,陈建成,等. 北京市林业产业高质量发展影响机理分析[J]. 北京林业大学学报(社会科学版),2022,21(3):37-45. [2] 汪浩. 林业产业集聚与经济增长的关系研究[J]. 统计与决策,2011(3):140-141. doi: 10.13546/j.cnki.tjyjc.2011.03.034 [3] 刘涛,李继霞. 中国林业绿色全要素生产率时空分异及其影响因素[J]. 世界林业研究,2020,33(6):56-61. doi: 10.13348/j.cnki.sjlyyj.2020.0109.y [4] 吴宁,林伟明,王强强. 中国林业产业集群的测度方法、动因及效应:基于中文文献综述视角[J]. 中国林业经济,2022(4):1-5. [5] 魏肖杰,张敏新. 林业产业集聚对中国林业全要素生产率作用机制:基于动态空间计量模型的实证分析[J]. 世界林业研究,2019,32(3):67-72. [6] TINBERGEN J. Zur theorie der langfristigen wirtschaftsentwicklung[J]. Weltwirtschaftliches Archiv,1942,55:511-549.
[7] ROBERT M S. A contribution to the theory of economic growth[J]. The Quarterly Journal of Economics,1956,70(1):65-91. doi: 10.2307/1884513
[8] 吕洁华,孙嘉宇,蔡秀亭. 中国林业绿色全要素生产率的时空演变分析[J]. 农林经济管理学报,2022,21(3):320-330. doi: 10.16195/j.cnki.cn36-1328/f.2022.03.34 [9] 董娅楠,缪东玲,程宝栋. FDI对中国林业全要素生产率的影响分析:基于DEA-Malmquist指数法[J]. 林业经济,2018,40(4):39-45. [10] 曹玉昆,翟相如. 国家财政支持对林业产业全要素生产率影响的实证[J]. 统计与决策,2020,36(7):118-122. doi: 10.13546/j.cnki.tjyjc.2020.07.025 [11] LIN Y,CHEN W H,LIU J C. Research on the temporal and spatial distribution and influencing factors of forestry output efficiency in China[J]. Sustainability,2021,13(9):4687. doi: 10.3390/su13094687
[12] 史常亮,揭昌亮,石峰,等. 中国林业技术效率与全要素生产率增长分解:基于SFA-Malmquist方法的估计[J]. 林业科学,2017,53(12):126-135. doi: 10.11707/j.1001-7488.20171214 [13] 王雅晖,王怡然,杨金霖,等. 林业产业专业化、多样化集聚对林业全要素生产率的影响[J]. 林业经济问题,2022,42(2):142-150. [14] 银西阳,贾小娟,李冬梅. 农业产业集聚对农业绿色全要素生产率的影响:基于空间溢出效应视角[J]. 中国农业资源与区划,2022,43(10):110-119. [15] 沈伟航,武婧妤,宁攸凉,等. 中国林产工业绿色全要素生产率测算:基于制造业31个分行业的面板数据[J]. 西北林学院学报,2021,36(4):282-288. doi: 10.3969/j.issn.1001-7461.2021.04.40 [16] 郑宇梅,尹少华. 林业产业生态效率实证研究:基于15个省的面板数据分析[J]. 林业经济,2016,38(11):36-40. [17] 谭少鹏. 我国林业绿色全要素生产率测度及其影响因素[J]. 中南林业科技大学学报,2022,42(8):202-210. [18] 宋美琼,程秋旺,陈钦,等. 林业绿色全要素生产率的时空变化及影响因素研究:以南方集体林区为例[J]. 绥化学院学报,2022,42(8):6-10. [19] 陈周光,崔伟伟,龙飞. 林业产业集聚对林业经济增长的影响研究:基于南方集体林区11省(自治区)实证分析[J]. 云南农业大学学报(社会科学),2022,16(5):62-71. [20] 夏永红,沈文星,李存芳. 木材加工产业集聚对劳动生产率影响的空间效应分解:基于1998—2016年省际空间面板数据的实证研究[J]. 林业科学,2019,55(9):157-165. [21] 余亚亮,刘笑冰. 福建省林业产业集聚与林业产业结构优化关系[J]. 林业经济问题,2020,40(5):537-544. doi: 10.16832/j.cnki.1005-9709.20190326 [22] 韦玉琼,龙飞. 非木质林产品产业集聚与产业生态效率分析[J]. 林业经济,2021,43(3):65-81. doi: 10.13843/j.cnki.lyjj.20210518.002 [23] 李玉洁,刘思思,贺正楚. 产业协同集聚、技术创新与绿色全要素生产率[J]. 系统工程,2023,41(1):1-14. [24] 刘耀彬,袁华锡,封亦代. 产业集聚减排效应的空间溢出与门槛特征[J]. 数理统计与管理,2018,37(2):224-234. doi: 10.13860/j.cnki.sltj.20171131-003 [25] 吴柏海,曾以禹,陈经伟. 财政支持林业新思考:战略定位、历史经验和政策创新[J]. 林业经济,2014,36(7):3-13. doi: 10.13843/j.cnki.lyjj.2014.07.001 [26] KAORU T. A slacks-based measure of efficiency in data envelopment analysis[J]. European Journal of Operational Research,2001,130(3):498-509. doi: 10.1016/S0377-2217(99)00407-5
[27] KAORU T. A slacks-based measure of super-efficiency in data envelopment analysis[J]. European Journal of Operational Research,2002,143(1):32-41. doi: 10.1016/S0377-2217(01)00324-1
[28] HOU J,TEO T S H,ZHOU F,et al. Does industrial green transformation successfully facilitate a decrease in carbon intensity in China? an environmental regulation perspective[J]. Journal of Cleaner Production,2018,184:1060-1071. doi: 10.1016/j.jclepro.2018.02.311
[29] FÄRE R,GROSSKOPF S,LINDGREN P,et al. Productivity changes in Swedish pharamacies 1980-1989:a non-parametric Malmquist approach[J]. Journal of Productivity Analysis,1992,3:85-101. doi: 10.1007/BF00158770
[30] HANSEN B E. Threshold effects in non-dynamic panels:estimation,testing,and inference[J]. Journal of Econometrics,1999,93:345-368. doi: 10.1016/S0304-4076(99)00025-1
[31] HANSEN B E. Sample splitting and threshold estimation[J]. Econometrica,2000,68(3):575-603. doi: 10.1111/1468-0262.00124
[32] ARELLANO M,BOND S. Some tests of specification for panel data:Monte Carlo evidence and an application to employment equations[J]. Review of Economic Studies,1991,58(2):277-297. doi: 10.2307/2297968
[33] 侯建,白婉婷,陈建成. 创新活力对区域工业高质量发展的门槛机理研究:环境规制视角[J]. 科技管理研究,2022,42(1):1-8.
计量
- 文章访问数: 220
- HTML全文浏览量: 59
- PDF下载量: 75
